Intro
Time for part 3! Previously we started reverse engineering the driver using Ghidra. While this works, it sometimes runs into problems when it's hard to understand how functions are called. To a large extent this is driven by the application being written in C++. The virtual function tables make it hard to figure out what function ends up at which offset. It's also not made easier by having to understand exactly how and when Windows calls functions in this driver.
In this post, I'll show how to leverage a debugger to try and fill in some of the blanks. In my reversing journey so far, this is has been helpful, but still quite tedious. I only resort to it when I am stuck and want to understand a particular piece of code better.
WinDbg - Setup
There are a few Windows debuggers out there and initially I tried to use x64dbg, however, I realised quickly that it doesn't do so well with debugging Windows drivers. Instead, it seems WinDbg is the recommended solution for that.
Given that I'm reversing on Linux, I first needed to spin up a VM, pass through the USB device and get everything working. I made sure the driver version matched (so I'm analysing the exact same binary), then set up Windows Hello with my fingerprint, did a reboot and login. Throughout this process I captured the USB traffic, just to confirm it looks similar to what I covered in the first post. Once I had confirmed all of this, I began debugging.
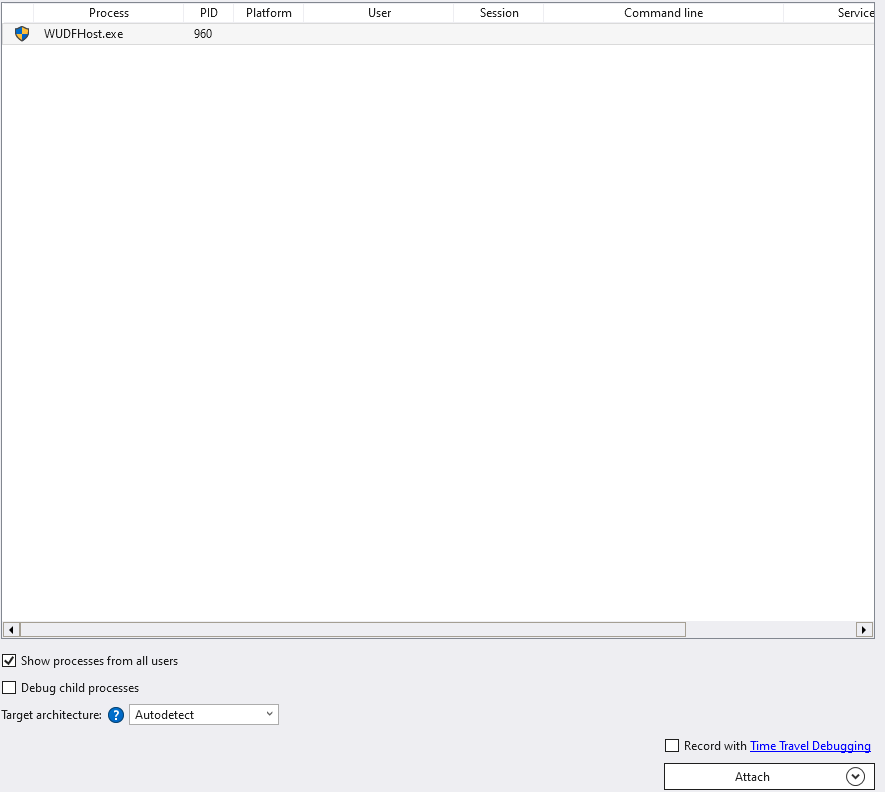
The first problem we face is that we can't exactly start the process from the
debugger, we need to attach to it. This isn't so hard as we can just attach to
the only WUDFHost.exe process we find (make sure to select "Show processes
from all users").
This works well enough, but brings up the next problem: When the USB device is connected it performs an initial handshake. Presumably, we need to understand this handshake so we actually want to attach from the start which is a bit difficult. Luckily, driver developers face a similar problem, so Microsoft offers a solution: How to Enable Debugging of a UMDF Driver.
It's a bit tricky to get right, and there are several ways to get to the same
destination: Setting a registry key that tells Windows to just wait a bit
before loading the driver. In my case, I had to set
Computer\HKEY_LOCAL_MACHINE\SOFTWARE\Microsoft\Windows NT\CurrentVersion\WUDF\Services\{193a1820-d9ac-4997-8c55-be817523f6aa}\HostProcessDbgBreakOnDriverLoad
to a number of seconds long enough for me to attach a debugger. It's currently
set to 0x60, for no particular reason. It's long enough.
Once you've set this value, reconnect the USB device (not sure if you have to reboot) and you can attach using WinDbg and catch the initialisation process.
WinDbg - Debugging
In my case, I disable USB passthrough to the VM, then re-enable it and attach the debugger. Take the following steps to make sure everything works as expected:
- With the USB device connected, open WinDbg
- Go to File > Attach to process
- Tick "Show processes from all users"
- Search for "wudf". Confirm there is a single
WUDFHost.exe. - Disconnect the device, e.g. by unplugging or disabling passthrough
- Hit the refresh symbol in WinDbg to confirm that the list is now empty.
- Reconnect the USB device. This starts the "timer" that waits for the debugger to attach.
- Refresh again, there should again be a single
WUDFHost.exe. - Select it and "Attach"
You should now find yourself attached, at a breakpoint, with the program paused.
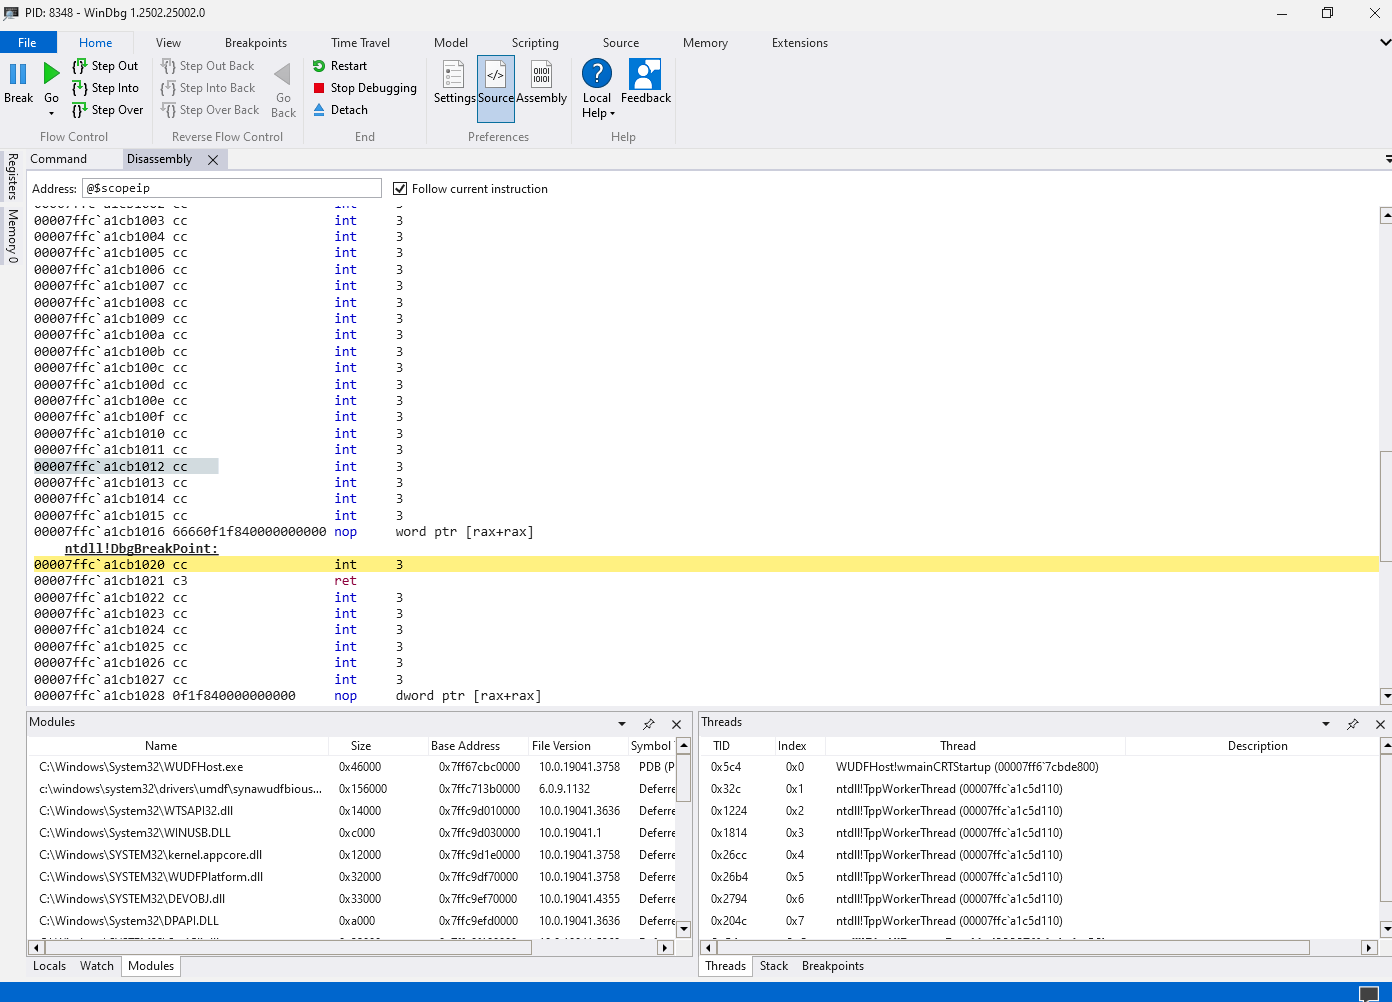
At this point, the driver has not been loaded and we can trace through its initialisation steps. The most challenging part, in my opinion, was aligning what I saw in Ghidra with what's in WinDbg. While Ghidra has a nice decompiled view and a lot of helpful context, WinDbg is much more bare bones, showing just assembly, register values etc, like a standard debugger. In addition, the addresses aren't identical, because Windows picks different base addresses to load the library into. I assume this is ASLR or something, but the important thing is that we need to find a way to navigate.
To achieve this, we use relative offsets, because those remain the same
between Ghidra and WinDbg. Let's see what that means on an example: Set a
breakpoint on the DllGetClassObject function that initialises the driver.
- Open up Ghidra and navigate to the function. In the "Listing" window in the centre, select the function entry point.
- Open up WinDbg, open the "Modules" view (select View > Modules). Find the
driver in the list. In our case it's
synawudfbiousb132.dll. Right click and "Copy Name". This will copy the entire path. - Go to View > Disassembly (if not already open) and at the top under "Address"
paste the path. Delete everything except the name, so that it just shows
synawudfbiousb132.dll. - Back in Ghidra, right click on the function and select "Copy Special" and then "Imagebase Offset". This copies the relative offset from the start of the file into the clipboard.
- In WinDbg, in the "Address" field enter
+ 0xand then "paste". The full address should now look something like this:synawudfbiousb132.dll + 0xdb50. - Deselect the "Follow current instruction" if it's selected. Otherwise WinDbg will replace what we've put in here which gets annoying when we want to navigate to another offset.
- Press Enter and it should navigate you to an address. Look through the first few rows of disassembled instructions. They should match between Ghidra & WinDbg. It means you've found the right spot.
- Right click on the first instruction and set a break point (F9).
- Select Home > Go. You may have to continue once more. Then you'll find yourself at the breakpoint.
WinDbg - Back to Ghidra
Back in Ghidra let's look at the disassembly for our code again:
/* WARNING: Function: _guard_dispatch_icall replaced with injection: guard_dispatch_icall */

HRESULT __stdcall DllGetClassObject(IID *rclsid,IID *riid,LPVOID *ppv)

{
  longlong lVar1;
  HRESULT HVar2;
  longlong *plVar3;

                    /* 0xdb50  1  DllGetClassObject */
  *ppv = NULL;
  lVar1._0_4_ = rclsid->Data1;
  lVar1._4_2_ = rclsid->Data2;
  lVar1._6_2_ = rclsid->Data3;
  if ((lVar1 == 0x4b29b08096710705) && (*(longlong *)rclsid->Data4 == 0x3a66ae3569b1eca3)) {
    plVar3 = (longlong *)operator_new(0x10);
    if (plVar3 == NULL) {
      plVar3 = NULL;
    }
    else {
      *(undefined4 *)((longlong)plVar3 + 0xc) = 0;
      *plVar3 = (longlong)&PTR_FUN_1800b8828;
      *(undefined4 *)(plVar3 + 1) = 1;
    }
    if (plVar3 == NULL) {
      HVar2 = -0x7ff8fff2;
    }
    else {
      HVar2 = (**(code **)*plVar3)(plVar3,riid,ppv);
      (**(code **)(*plVar3 + 0x10))(plVar3);
    }
  }
  else {
    if (((undefined **)PTR_LOOP_180131028 != &PTR_LOOP_180131028) &&
       (((PTR_LOOP_180131028[0x1c] & 1) != 0 && (1 < (byte)PTR_LOOP_180131028[0x19])))) {
      FUN_18000dcc0(*(undefined8 *)(PTR_LOOP_180131028 + 0x10),10,&DAT_1800b8808,rclsid);
    }
    HVar2 = -0x7ffbfeef;
  }
  return HVar2;
}
There's a line (**(code **)(*plVar3 + 0x10))(plVar3); that's quite hard to
decipher. In this example it's actually okay, because we can figure from the
rest of the code that this is offset 0x10 from PTR_FUN_1800b8828, but in
other places we won't have that. Then' well want to know what the actual
address is that this function is located at.
We can leverage WinDbg for that: We set a breakpoint at the instruction that calls this function and we'll see what address it is going to call, which we can then bring back to Ghidra, so let's do that. In Ghidra, we navigate to the instruction:
18000dbdd ff 15 95        CALL       qword ptr [->_guard_dispatch_icall]              int FUN_18000db20(LPVOID param_1)
          7a 0a 00                                                                    undefined _guard_dispatch_icall(
Then, using the previous method we navigate to this address in WinDbg. You can
also "spot" the offset in the text above: It's 0xdbdd Set a breakpoint in
WinDbg and run until it hits the breakpoint. In WinDbg's Disassembly view we
see this now:
00007ffc`713bdbdd ff15957a0a00 call qword ptr [7FFC71465678h]
This is a function call to a specific address.
We can turn this back into a Ghidra address by similarly taking this address'
offset. The easiest way I've found so far is to write down the "Base Address"
for the driver DLL from the "Modules" window in WinDbg (in my example
0x7FFC713B0000) and then grab a calculator that can handle hex (e.g. KCalc)
and calculate the offset: 0x7FFC71465678 - 0x7FFC713B0000 = 0xB5678. In
Ghidra, select Navigation > Go To and enter 0x180000000 + 0xB5678 (the base
address Ghidra uses plus the offset we want to go to). We find ourselves here:
       1800b5678 50 15 0b        addr       _guard_dispatch_icall
                 80 01 00
                 00 00
What happened here? Well, the function call actually isn't direct, but Ghidra abstracted that away for us. However, if we go to that function, we find that there's only one instruction here:
1800b1550 ff e0 JMP RAX
Effectively, it calls whatever is in RAX. So let's look at what value is
currently in RAX in WinDbg. It's this ability to look up dynamic values that
we're interested in as Ghidra doesn't have them during static analysis. In
WinDbg's "Registers" window, RAX currently has 0x00007FFC713BDB20 so let's
do the same thing again: 0x7FFC713BDB20 - 0x7FFC713B0000 = 0xDB20. And let's
go there in Ghidra: 0x180000000 + 0xDB20. This puts us exactly at the entry
point of a function that Ghidra shows as this:
int FUN_18000db20(LPVOID param_1)

{
  int *piVar1;
  int iVar2;

  LOCK();
  piVar1 = (int *)((longlong)param_1 + 8);
  iVar2 = *piVar1;
  *piVar1 = *piVar1 + -1;
  UNLOCK();
  if (iVar2 + -1 == 0) {
    thunk_FUN_18008f8d0(param_1);
  }
  return iVar2 + -1;
}
If you ever don't land precisely where you expected, double check your values. If it doesn't "feel" right and doesn't seem to make sense, you might have made a mistake. Or there's something new to learn.
In this instance, we can actually confirm we found the right function: The
original code had a direct reference to the vtable so if we go there and then
navigate to offset 0x10 we should find a pointer to this function. Let's go
to PTR_FUN_1800b8828:
                     PTR_FUN_1800b8828                               XREF[4]:     DllGetClassObject:18000db9b(*),
                                                                                  DllGetClassObject:18000dba2(*),
                                                                                  DllGetClassObject:18000dbc8(R),
                                                                                  DllGetClassObject:18000dbd1(*)
1800b8828 e0 da 00        addr       AutoClass1::FUN_18000dae0
         80 01 00
         00 00
1800b8830 d0 da 00        addr       FUN_18000dad0
         80 01 00
         00 00
                     PTR_FUN_1800b8838                               XREF[1]:     DllGetClassObject:18000dbd9(R)
1800b8838 20 db 00        addr       FUN_18000db20
         80 01 00
         00 00
At offset 0x10 from PTR_FUN_1800b8828 we find FUN_18000db20 which is
exactly what we found above, too.
This means, as we continue our analysis, if we come across a function that
calls into the vtable we can now try dynamic analysis with WinDbg to figure
out what that vtable looks like.